

The Luminex FLEXMAP 3D® System – A Multiplexed Analytical Platform for Novel Biomarker Discovery
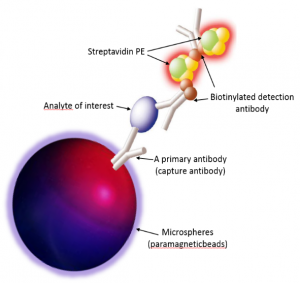
Figure 1. Luminex bead architecture technology
ICBR Proteomics & Mass Spectrometry (PM) Core is now offering access to the Luminex FLEXMAP 3D® analytical platform for discovering and validation of protein biomarkers across a wide range of diseases. The FLEXMAP 3D® system combines differentially dyed fluorescent microsphere sets with an innovative instrument design to enable simultaneous measurement of the concentration of a large number of different analytes in a rapid multiplexed assay capable of detecting up to 500 unique analytes a single sample. Each bead signature is defined by two fluorescent coded dyes (red and infra-red) and is linked to an analyte-specific capture antibody. Antibody-analyte binding is detected using an analyte-specific, biotin-conjugated antibody and streptavidin PE-conjugated second step detector (Figure 1). Analyte levels are determined on the advanced flow cytometry-based FLEXMAP 3D instrument.
The Luminex platform is capable of simultaneously multiplexing up to 500 unique assays at pg/ml sensitivity in a single sample. In a validation study using human cell extracts and a 41-plex bead kit, 26 cytokine and chemokine biomarkers were successfully quantified with a mean intra-assay CV of less than 10%. (Table 1). The standard curves for each analyte were highly reproducible from run to run (data not shown). Based on a two-sided p-value of ≤0.05, 15 out of 26 cytokine/chemokine biomarkers showed significant differences among the three different cell lines (Figure 2).
If you are interested in learning more about this powerful technology please contact the Proteomics & Mass Spectrometry Core at ICBR-Proteomics@ad.ufl.edu.
Table 1. Intra-assay precision of multiplex assays for 26 biomarkers in human multiple myeloma (1-MM), T-cell acute lymphoblastic leukemia (2-T-ALL), and B-cell acute lymphoblastic leukemia (3-B-ALL) extracts. Intra-assay precision is generated from the mean of the % CV’s from 27 reportable results.
| Analyte | Vendor
Intra-assay %CV |
Vendor
Inter-assay %CV (n=6) |
ICBR PM
Intra-assay %CV With STDEV |
| FGF-2 | 2.3 | 4.8 | 2.00 ± 0.02 |
| G-CSF | 1.8 | 15.5 | 2.68 ± 0.02 |
| Flt-3L | 2.4 | 6.6 | 3.85 ± 0.03 |
| GM-CSF | 3.1 | 10.1 | 3.17 ± 0.02 |
| Fractalkine | 4.5 | 9.4 | 1.97 ± 0.01 |
| IFNα2 | 2.4 | 13.3 | 3.19 ± 0.02 |
| IFNγ | 1.6 | 12 | 3.46 ± 0.03 |
| GRO | 2.1 | 9.2 | 3.81 ± 0.04 |
| MCP-3 | 1.6 | 6.4 | 6.72 ± 0.02 |
| IL-13 | 2.2 | 9.2 | 9.41 ± 0.06 |
| IL-15 | 2.7 | 8.1 | 6.21 ± 0.03 |
| PDGF-BB | 2.1 | 12.3 | 4.56 ± 0.04 |
| sCD40L | 3.7 | 18.9 | 2.98 ± 0.01 |
| IL-7 | 1.7 | 16.1 | 6.94 ± 0.05 |
| IL-8 | 1.9 | 3.5 | 9.15 ± 0.04 |
| TNFα | 2.6 | 13 | 5.62 ± 0.04 |
| TNFβ | 1.6 | 11.4 | 6.40 ± 0.02 |
| RANTES | 1.9 | 5 | 5.87 ± 0.04 |
| MIP-1α | 1.9 | 14.5 | 3.09 ± 0.03 |
| IL-12P40 | 2.8 | 12.4 | 5.96 ± 0.06 |
| MDC | 1.6 | 7.2 | 5.43 ± 0.05 |
| PDGF-AA | 4.3 | 16.7 | 6.80 ± 0.07 |
| IL-9 | 2.4 | 8.4 | 7.16 ± 0.07 |
| IL-2 | 2.1 | 6.3 | 4.91 ± 0.05 |
| IL-3 | 2.1 | 6.1 | 4.58 ± 0.05 |
| IL-5 | 2.6 | 10.8 | 5.16 ± 0.05 |
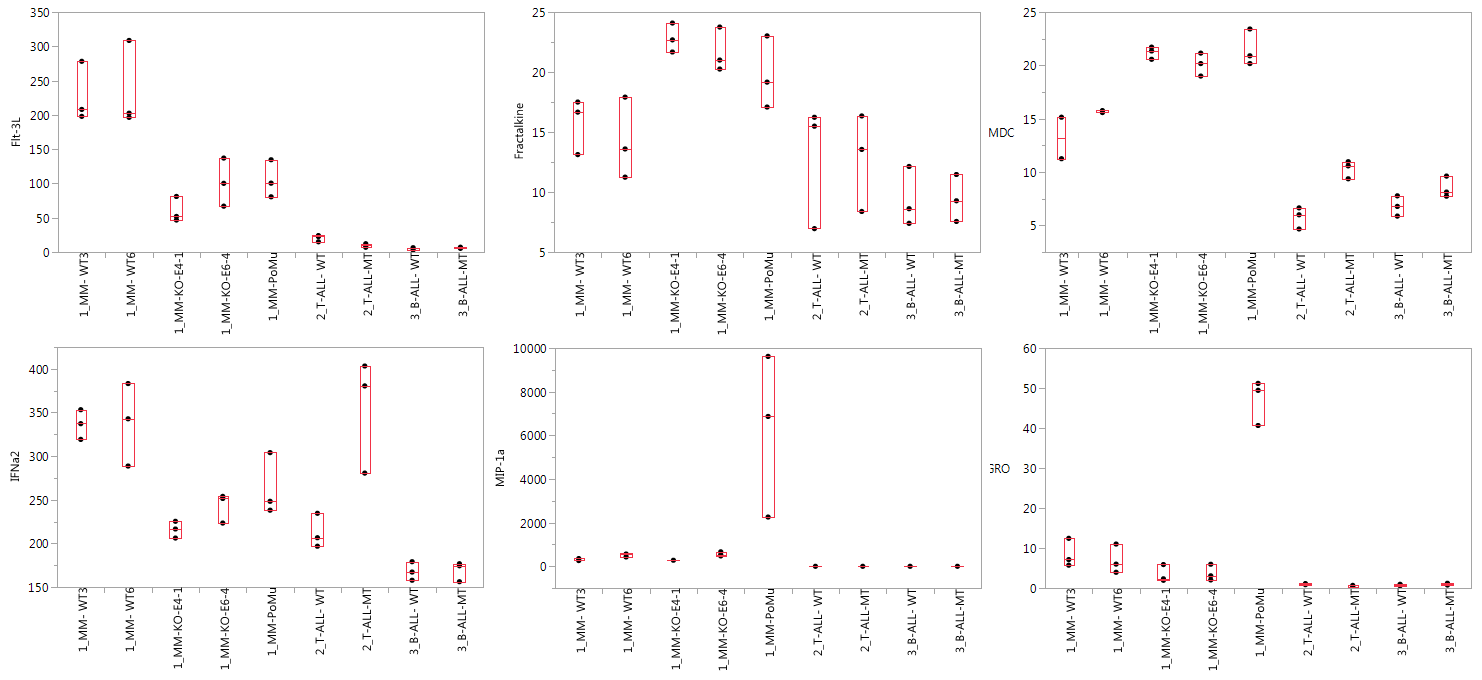
Figure 2. Relative levels of cytokines/chemokines in nine groups from three different cell lines . Each vertical bar represents the quantile of data distribution based on the mean fluorescent intensity (MFI) from biological triplicates for each analyte.